Market structure · Free guide
The breakout closed above the high. Did it hold?
The first break is the easiest candle to fake. Here's how to tell a breakout that's real from one that only exists to pull you in at the worst price.
Why the breakout candle lies
A clean high is easy to see, so it collects orders. Traders who sold the range park their stops just above it. Breakout traders park their buy orders in the same spot. When price pushes through, both fire at once: stops trigger, breakout buyers pile in, and the candle looks unstoppable.
That's exactly why it's the easiest candle to fake. It's made of orders that were always going to fire there. It proves the level was attacked. It doesn't prove the attack worked.
A higher high is a label, not control.
It records what price already printed. Who's in control shows up after the break, when price comes back to the level and defends it or gives it up.
Same candle, two endings
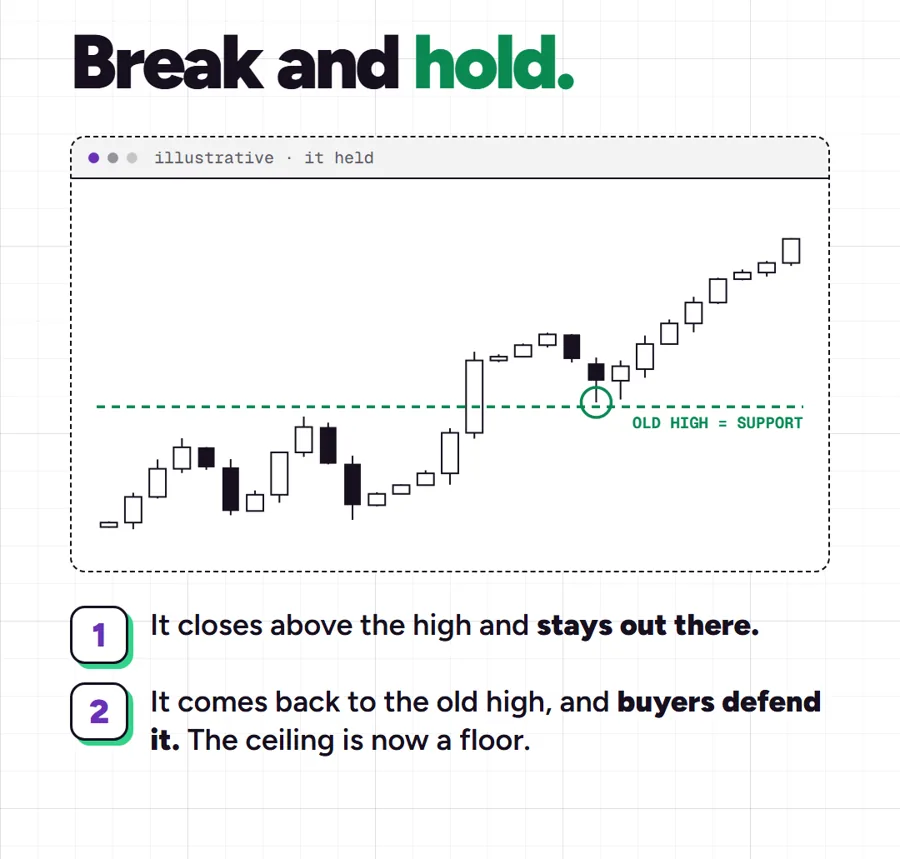
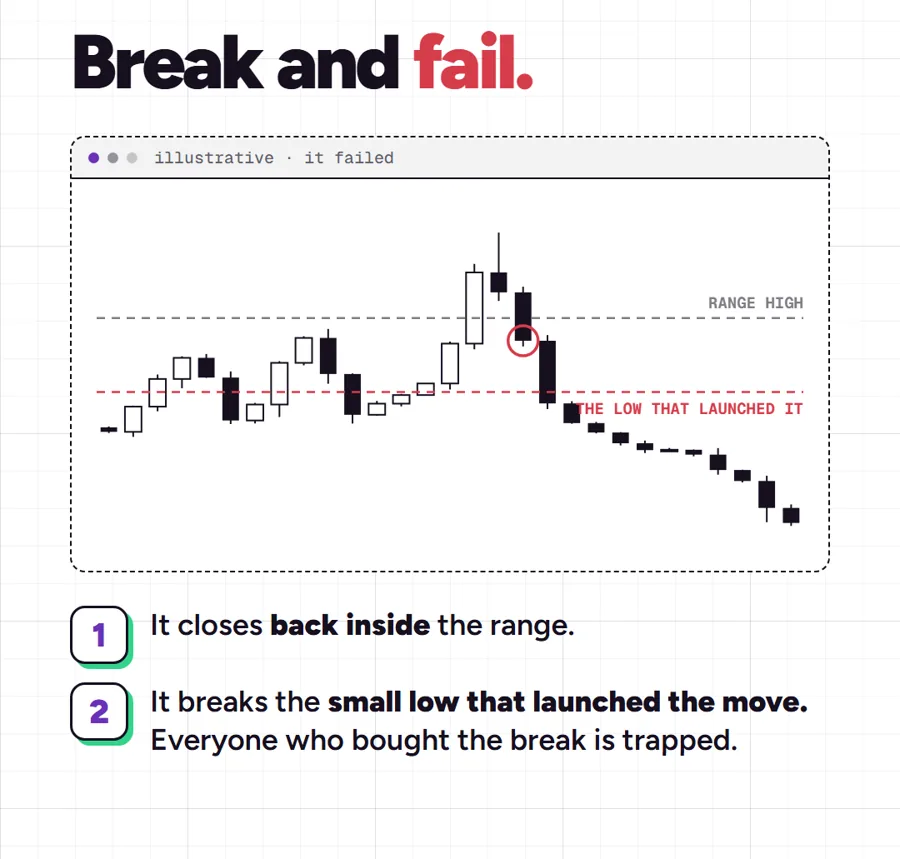
Break and hold. Price closes above, stays out there, then comes back to the old high, and buyers defend it. The old ceiling is now a floor.
Break and fail. Price closes back inside the range, then breaks the small low that launched the move. Everyone who bought the break is trapped above.
At the moment of the break, the two look identical. Only the next few candles tell you which one you're in.
What a real break looks like
- It doesn't have to explode. Price can pause, drift and even pull back after a real break.
- It can't close straight back inside. A quick return under the level is a failed break, not a pullback.
- The retest is the proof. Price touches the old level from the other side and gets pushed away from it.
Check where you are first
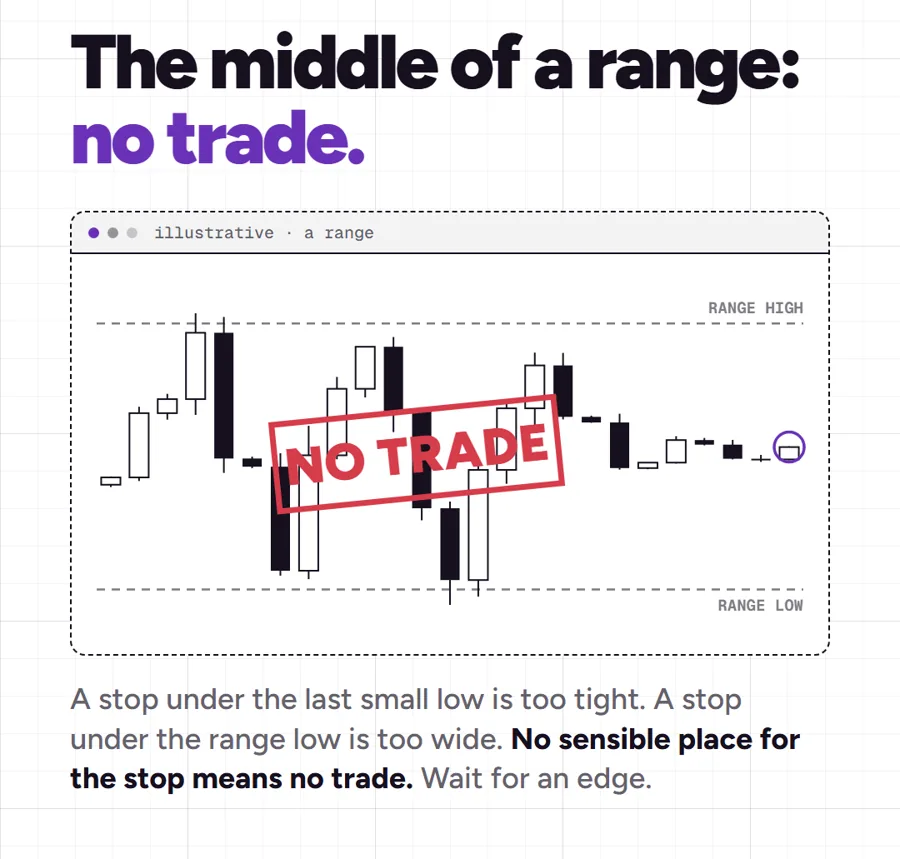
Is price at an edge of the range, or in the middle? In the middle there's no sensible place for a stop: under the last small low is too tight, under the range low is too wide. No logical stop means no trade. Wait for an edge.
One question before you click
Did it break and hold, or break and fail?
- Hold: it stays outside and the retest is defended. Trade the retest, with the stop on the other side of the level.
- Fail: it closes back inside. Don't chase. Wait for the small low behind the move to break, then trade with the trapped side, stop beyond the failed extreme.
No answer yet? No click. And when there is one, size from the dollars you're willing to lose, never from a feeling. MK Trading Desk does that math for you: set the stop and the order ticket works out the lots.
The feeling to watch for
The breakout candle is built to make you feel late. That feeling is the setup working on you. Waiting for the hold costs you a slightly worse price on the breaks that work, and saves you the whole loss on the ones that only existed to pull you in.
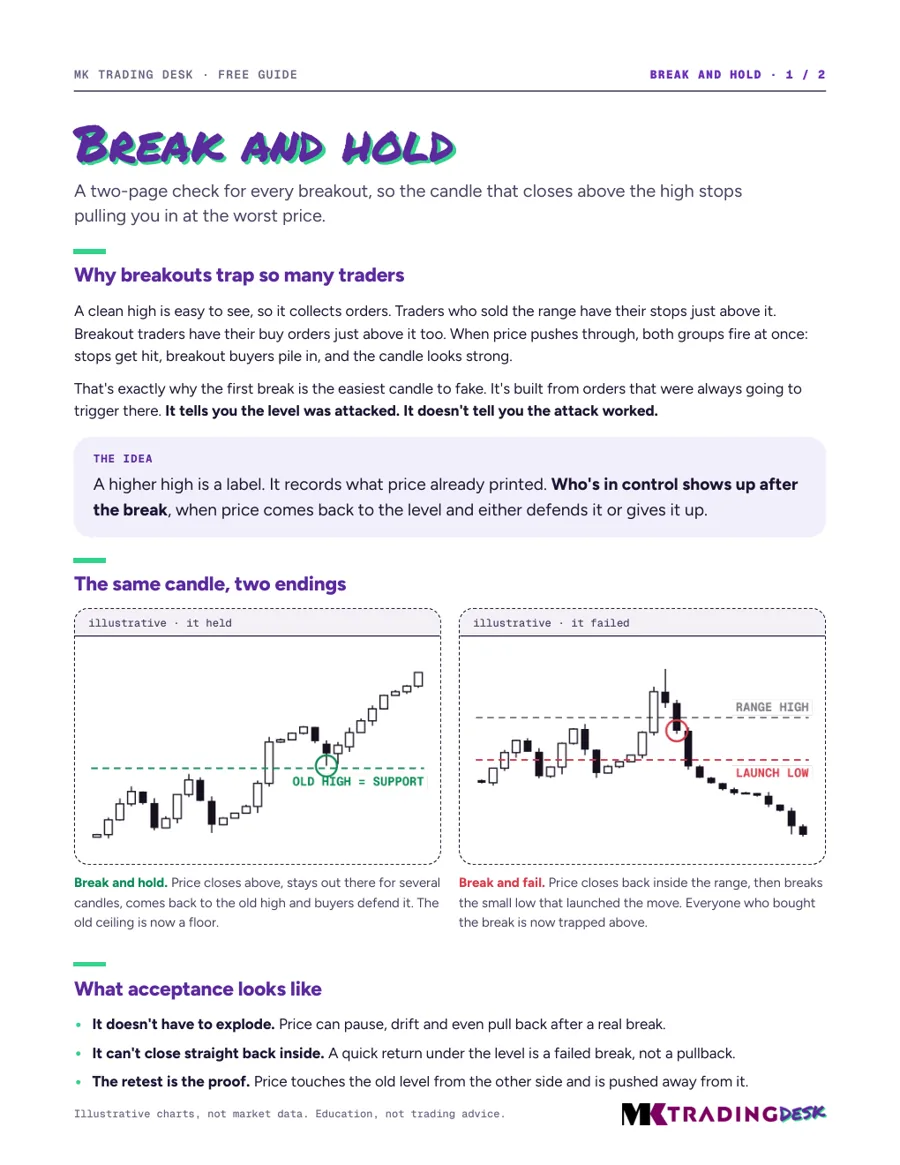
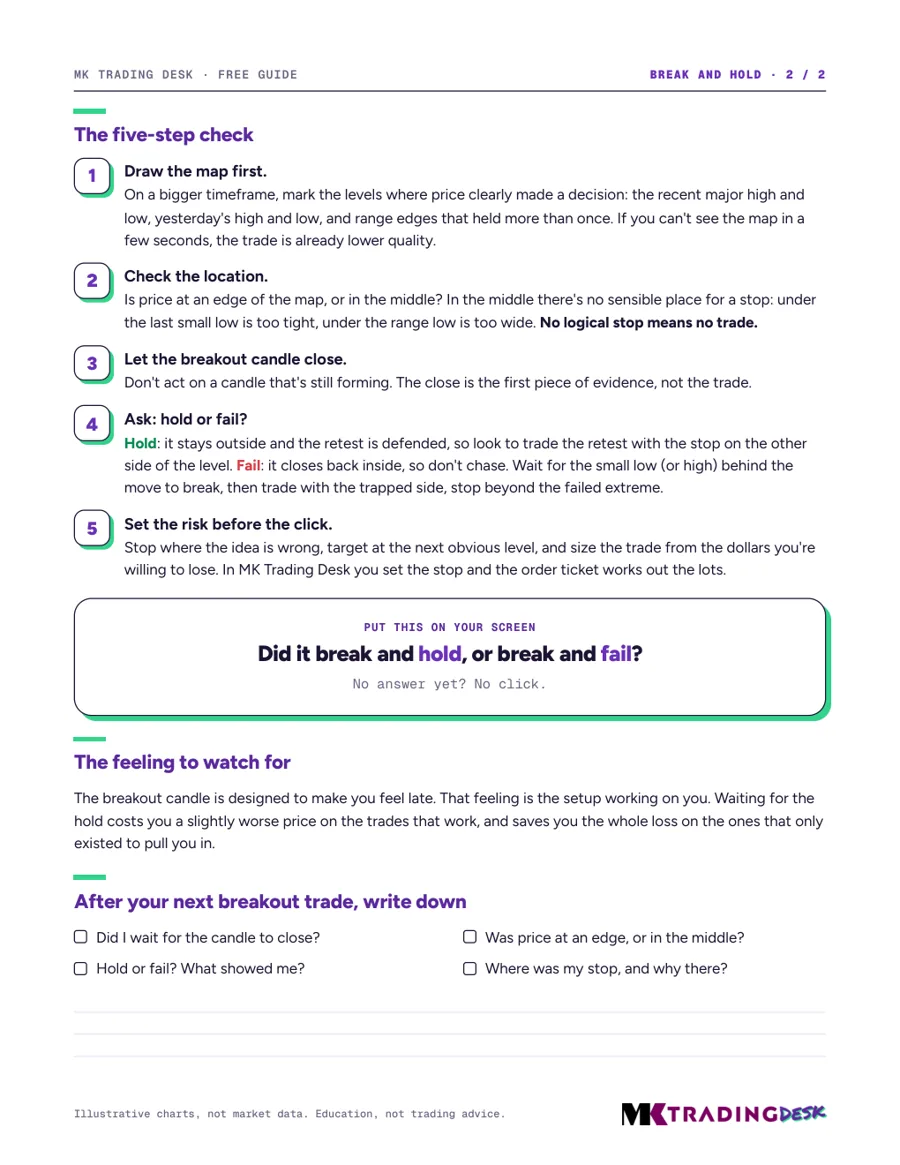
Free PDF · 2 pages
Get the Break and Hold check
The whole check on two pages you can keep beside your chart.
- The five-step breakout check, in order
- Hold vs. fail, side by side
- A one-question card for your screen
- What to write down after every breakout trade
Your guide is downloading.
Didn't start? Download it here (the link works for five minutes). Print the two pages and keep them beside your chart.